参考链接:
https://blog.csdn.net/lm_is_dc/article/details/81191207
matplotlib绘图
关注公众号“轻松学编程”了解更多。
Series和DataFrame都有一个用于生成各类图表的plot方法。默认情况下,它们所生成的是线形图
%matplotlib inline 是IPython 中的一个魔法函数。
以下命令都是在浏览器中输入。
cmd命令窗口输入:jupyter notebook
后打开浏览器输入网址http://localhost:8888/
导入库
1
2
3
4
5
6
7
8
9
| import numpy as np
import pandas as pd
import matplotlib.pyplot as plt
from pandas import Series,DataFrame
%matplotlib inline
plt.rcParams['font.sans-serif']=['SimHei']
plt.rcParams['axes.unicode_minus']=False
|
一、Matplotlib基础知识
Matplotlib中的基本图表包括的元素
- x轴和y轴 axis
水平和垂直的轴线 - x轴和y轴刻度 tick
刻度标示坐标轴的分隔,包括最小刻度和最大刻度 - x轴和y轴刻度标签 tick label
表示特定坐标轴的值 - 绘图区域(坐标系) axes
- 坐标系标题 title
- 轴标签 xlabel ylabel
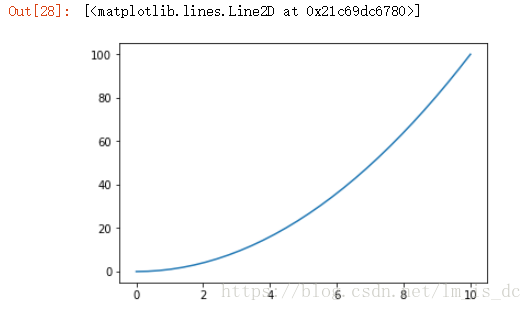
1、包含单条曲线的图 plt.plot(x)
1
2
3
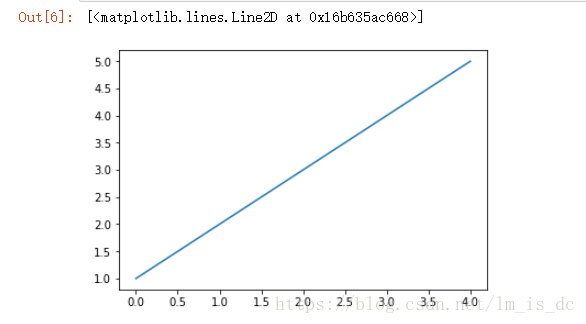
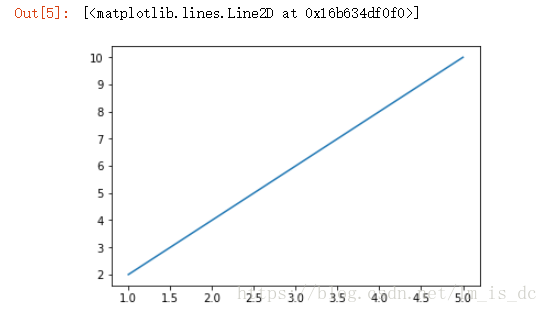
| x=[1,2,3,4,5]
y=[2,4,6,8,10]
plt.plot(x,y)
|
1
2
3
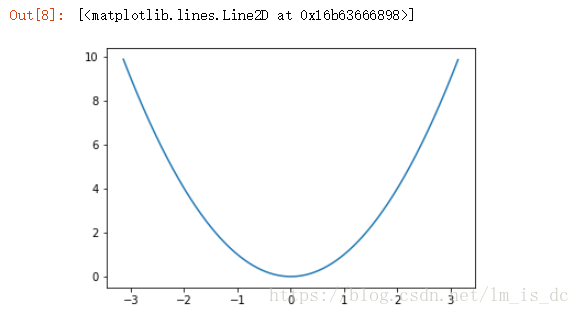
| x1=np.arange(-np.pi,np.pi,0.01)
y1=x1**2
plt.plot(x1,y1)
|
1
2
3
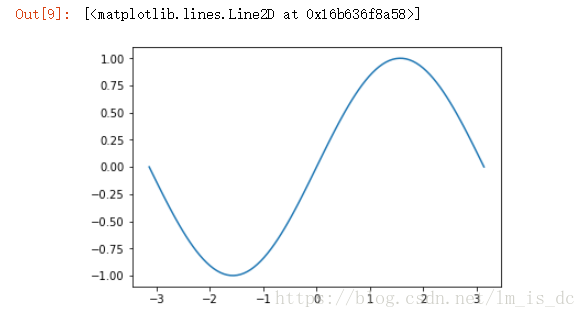
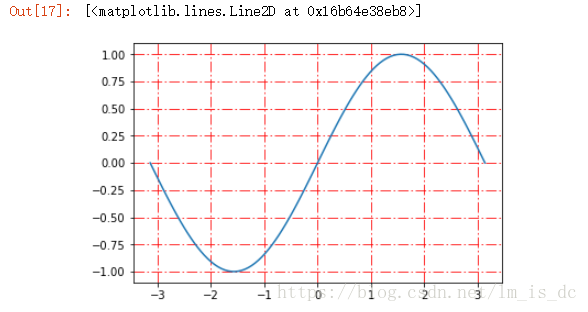
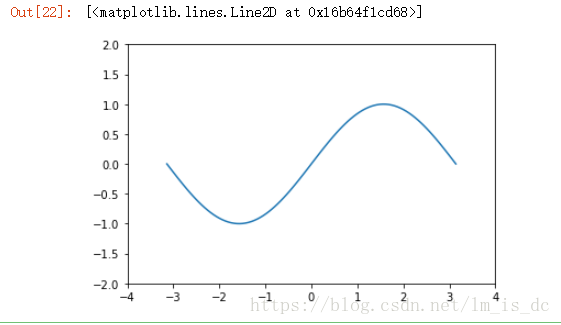
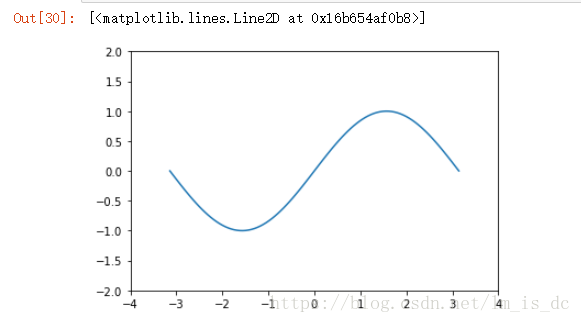
| x=np.linspace(-np.pi,np.pi,100)
y=np.sin(x)
plt.plot(x,y)
|
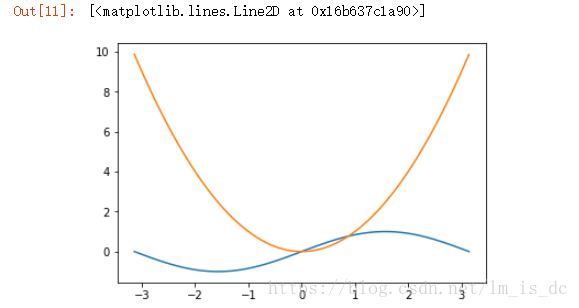
2、包含多个曲线的图
2.1、连续调用多次plot函数
1
2
| plt.plot(x,y)
plt.plot(x1,y1)
|
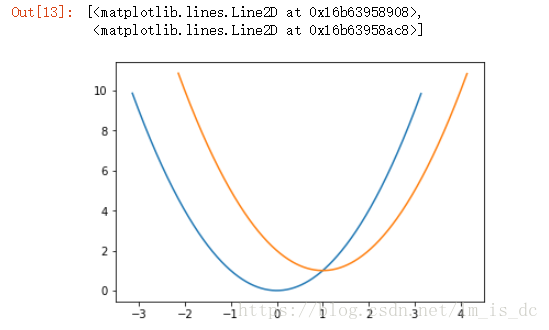
2.2、也可以在一个plot函数中传入多对X,Y值,在一个图中绘制多个曲线
1
| plt.plot(x1,y1,x1+1,y1+1)
|
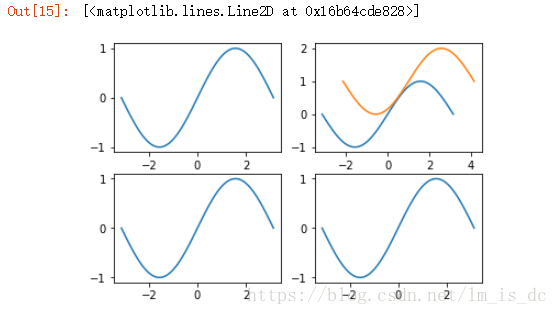
3、将多个曲线图绘制在一个table区域中:对象形式创建表图
- a=plt.subplot(row,col,loc) 创建曲线图
- a.plot(x,y) 绘制曲线图
1
2
3
4
5
6
7
8
9
10
11
12
13
14
|
a1=plt.subplot(2,2,1)
a1.plot(x,y)
a2=plt.subplot(2,2,2)
a2.plot(x,y)
a2.plot(x+1,y+1)
a3=plt.subplot(2,2,3)
a3.plot(x,y)
a4=plt.subplot(224)
a4.plot(x,y)
|
4、网格线 gride(XXX)
参数:
- axis
- color:支持十六进制颜色
- linestyle: – -. :
- alpha
绘制一个正弦曲线图,并设置网格
1
2
| plt.grid(color='r',linestyle='-.')
plt.plot(x,y)
|
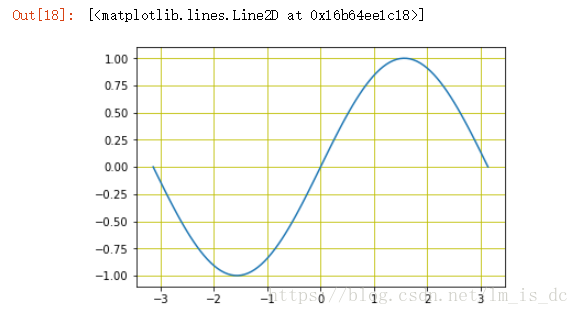
1
2
3
| ax_1=plt.subplot(111)
ax_1.grid(color='y')
ax_1.plot(x,y)
|
1
2
3
4
5
6
7
8
9
10
11
12
13
14
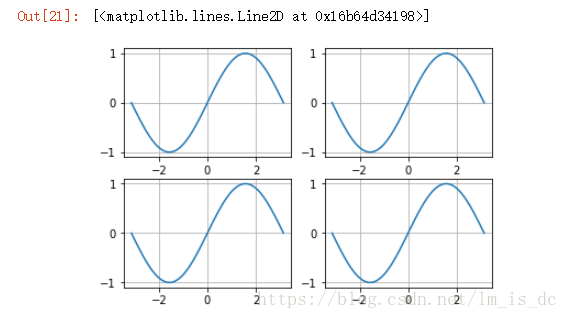
| x=np.linspace(-np.pi,np.pi,100)
y=np.sin(x)
a1=plt.subplot(221)
a1.grid()
a1.plot(x,y)
a2=plt.subplot(222)
a2.grid()
a2.plot(x,y)
a3=plt.subplot(223)
a3.grid()
a3.plot(x,y)
a4=plt.subplot(224)
a4.grid()
a4.plot(x,y)
|
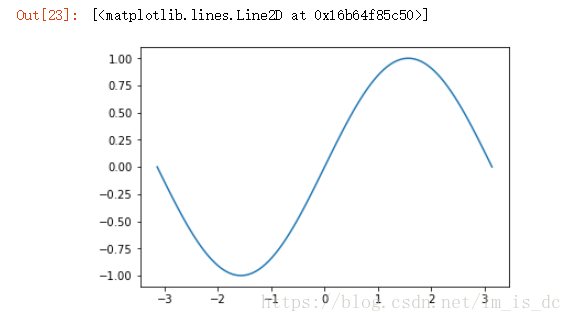
5、坐标轴界限
5.1 axis方法:修改x,y轴刻度值
plt.axis([xmin,xmax,ymin,ymax])
1
2
| plt.axis([-4,4,-2,2])
plt.plot(x,y)
|
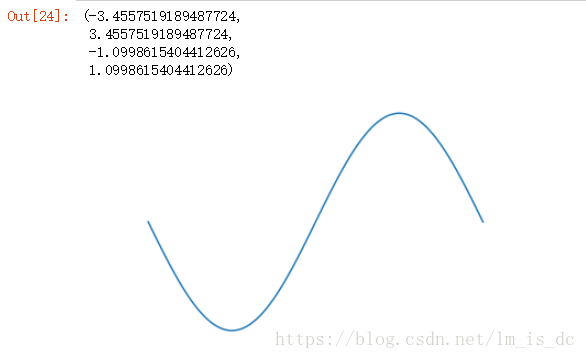
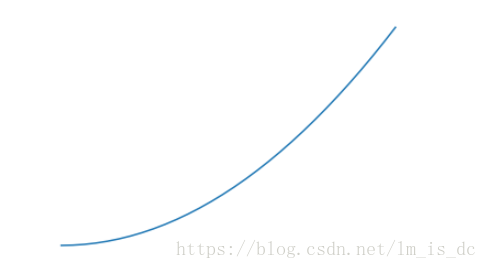
5.2 plt.axis(‘off’)
关闭坐标轴
1
2
| plt.plot(x,y)
plt.axis('off')
|
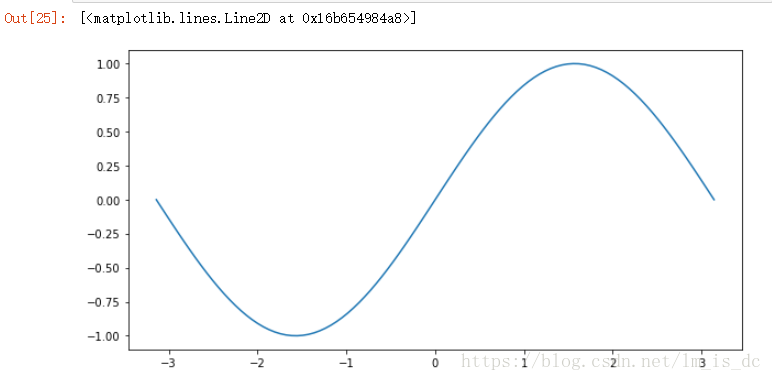
设置画布比例:plt.figure(figsize=(a,b))
a:x刻度比例;
b:y刻度比例 (2:1)表示x刻度显示为y刻度显示的2倍 。
1
2
| plt.figure(figsize=(10,5))
plt.plot(x,y)
|
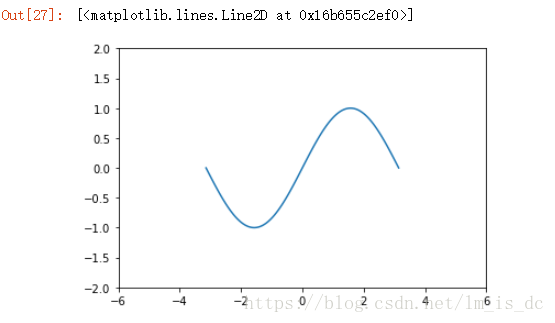
5.4 xlim方法和ylim方法
还可以通过plt的xlim(xmin,xmax),ylim方法设置坐标轴范围
1
2
3
| plt.xlim(-6,6)
plt.ylim(-2,2)
plt.plot(x,y)
|
5.5 通过对象的方式设置x,y轴的刻度值范围 ax.set_xlim(a,b)
1
2
3
4
| ax1=plt.subplot(111)
ax1.set_xlim(-4,4)
ax1.set_ylim(-2,2)
ax1.plot(x,y)
|
1
2
3
4
5
6
7
8
9
10
11
12
|
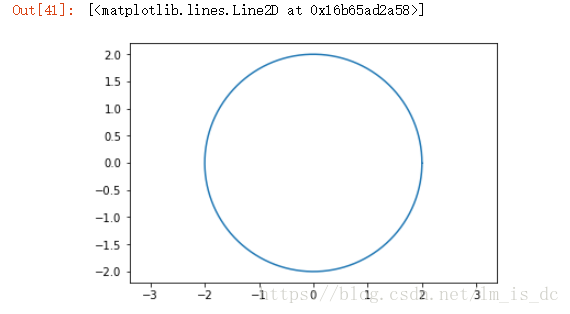
r = 2.0
a, b = (0., 0.)
theta = np.arange(0, 2*np.pi, 0.01)
x = a + r * np.cos(theta)
y = b + r * np.sin(theta)
axes = plt.subplot(111)
axes.axis('equal')
axes.plot(x, y)
|
1
2
3
4
5
6
7
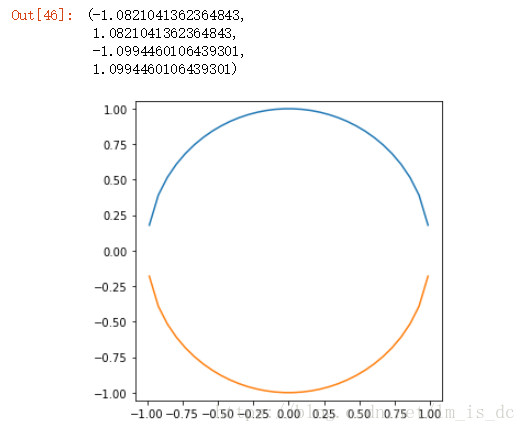
| x=np.linspace(-np.pi,np.pi,100)
y=(1-x**2)**0.5
y_=-y
plt.figure(figsize=(5,5))
plt.plot(x,y)
plt.plot(x,y_)
plt.axis('equal')
|
6、坐标轴标签
- color 标签颜色
- fontsize 字体大小
- rotation 旋转角度
- plt的xlabel方法和ylabel方法
1
2
3
4
5
6
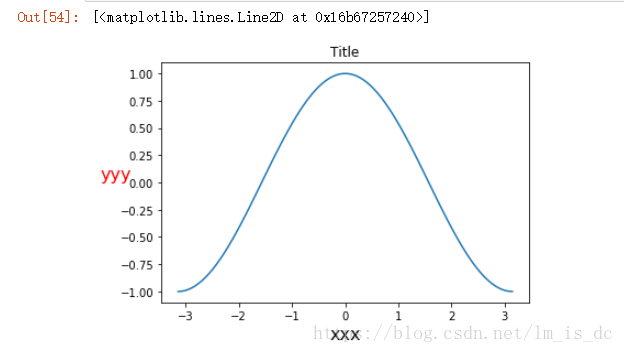
| x=np.linspace(-np.pi,np.pi,100)
y=np.cos(x)
plt.title('Title')
plt.ylabel(s='yyy',fontsize=16,rotation=0,color='r')
plt.xlabel(s='xxx',fontsize=16)
plt.plot(x,y)
|
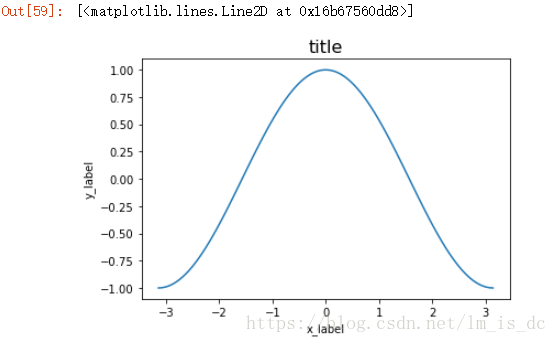
1
2
3
4
5
| ax=plt.subplot(111)
ax.set_xlabel('x_label')
ax.set_ylabel('y_label')
ax.set_title('title',fontsize=16)
ax.plot(x,y)
|
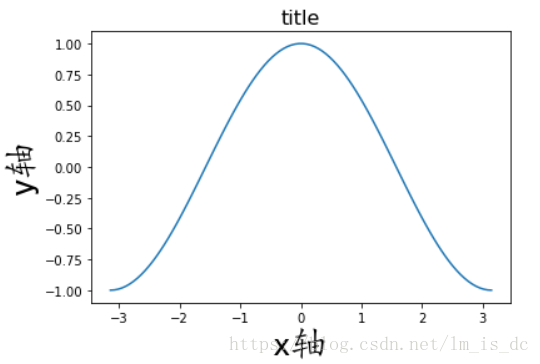
6.1 显示坐标轴中文标签
设置参数:fontproperties
1
2
3
4
5
6
7
| x=np.linspace(-np.pi,np.pi,100)
y=np.cos(x)
ax=plt.subplot(111)
ax.set_xlabel('x轴',fontproperties='KaiTi',fontsize=30)
ax.set_ylabel('y轴',fontproperties='KaiTi',fontsize=30)
ax.set_title('title',fontsize=16)
ax.plot(x,y)
|
其它字体:

7、标题
plt.title()方法
ax.set_title()方法
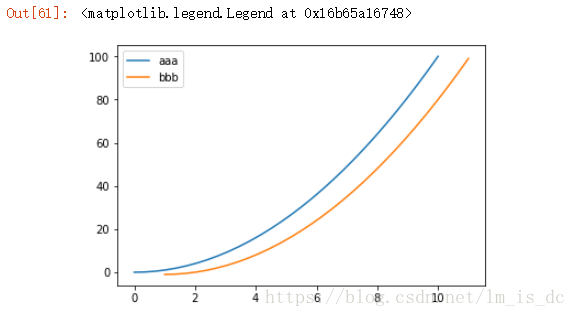
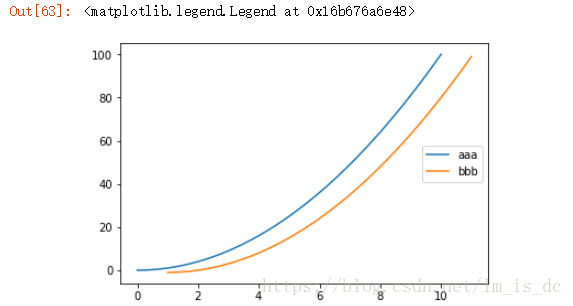
8、图例
8.1 legend方法
两种传参方法:
- 分别在plot函数中增加label参数,再调用plt.legend()方法显示
- 直接在legend方法中传入字符串列表
1
2
3
4
5
| x=np.linspace(0,10,30)
y=x ** 2
plt.plot(x,y,label='aaa')
plt.plot(x+1,y-1,label='bbb')
plt.legend()
|
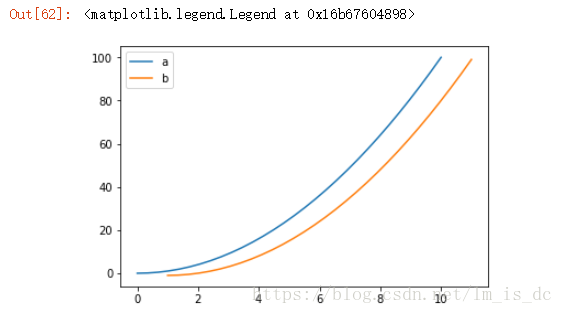
1
2
3
| plt.plot(x,y)
plt.plot(x+1,y-1)
plt.legend(['a','b'])
|
8.2 legend的参数
- loc参数
- loc参数用于设置图例标签的位置,一般在legend函数内
- matplotlib已经预定义好几种数字表示的位置
| 字符串 | 数值 | 字符串 | 数值 |
|---|
| best | 0 | center left | 6 |
| upper right | 1 | center right | 7 |
| upper left | 2 | lower center | 8 |
| lower left | 3 | upper center | 9 |
| lower right | 4 | center | 10 |
| right | 5 | | |
1
2
3
| plt.plot(x,y)
plt.plot(x+1,y-1)
plt.legend(['aaa','bbb'],loc=5)
|
loc参数可以是2元素的元组,表示图例左下角的坐标
- [0,0] 左下
- [0,1] 左上
- [1,0] 右下
- [1,1] 右上
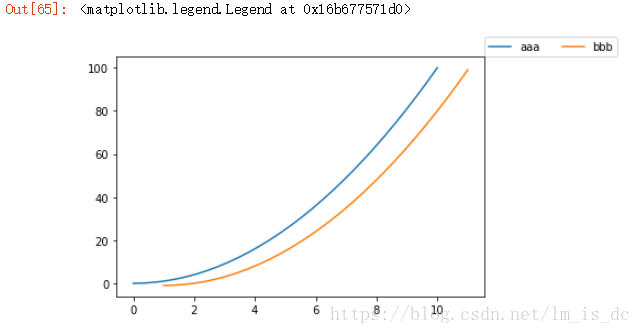
- ncol参数
ncol控制图例中有几列,在legend中设置ncol
1
2
3
| plt.plot(x,y)
plt.plot(x+1,y-1)
plt.legend(['aaa','bbb'],loc=[1,1],ncol=2)
|
9、保存图片
fig = plt.figure()
figure.savefig的参数选项
- filename
含有文件路径的字符串或Python的文件型对象。图像格式由文件扩展名推断得出,例如,.pdf推断出PDF,.png推断出PNG
(“png”、“pdf”、“svg”、“ps”、“eps”……) - dpi
图像分辨率(每英寸点数),默认为100 - facecolor ,打开保存图片查看
图像的背景色,默认为“w”(白色)
1
2
3
4
5
6
7
|
fig=plt.figure()
plt.axis('off')
plt.plot(x,y)
fig.savefig(filename='./111.jpg',dpi=500)
|
1
2
3
4
|
img=plt.imread('./111.jpg')
plt.imshow(img)
plt.show()
|
二、设置plot的风格和样式
plot语句中支持除X,Y以外的参数,以字符串形式存在,来控制颜色、线型、点型等要素,语法形式为: plt.plot(X, Y, ‘format’, …)
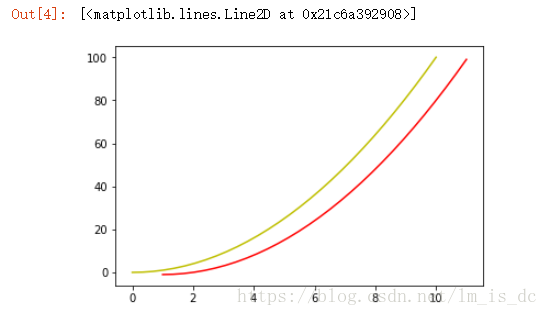
1、颜色
参数color或c
1
2
3
4
| x=np.linspace(0,10,30)
y=x ** 2
plt.plot(x,y,c='y')
plt.plot(x+1,y-1,color='r')
|
颜色值的方式
| 颜色 | 别名 | HTML颜色名 | 颜色 | 别名 | HTML颜色名 |
|---|
| 蓝色 | b | blue | 绿色 | g | green |
| 红色 | r | red | 黄色 | y | yellow |
| 青色 | c | cyan | 黑色 | k | black |
| 洋红色 | m | magenta | 白色 | w | white |
- HTML十六进制字符串
- 归一化到[0, 1]的RGB元组
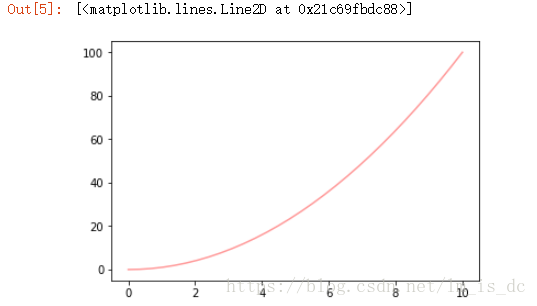
2、透明度
alpha参数
1
2
| ax=plt.subplot(111)
ax.plot(x,y,c='r',alpha=0.4)
|
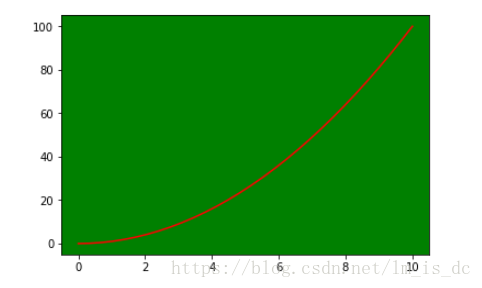
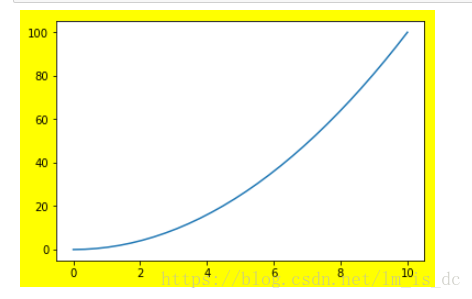
3、背景色
设置背景色,通过传入facecolor参数,来设置坐标轴的背景色
1
2
3
4
|
ax=plt.subplot(111)
ax.plot(x,y,c='r')
ax.set_facecolor('green')
|
1
2
3
4
|
f=plt.figure()
p=plt.plot(x,y)
f.set_facecolor('yellow')
|
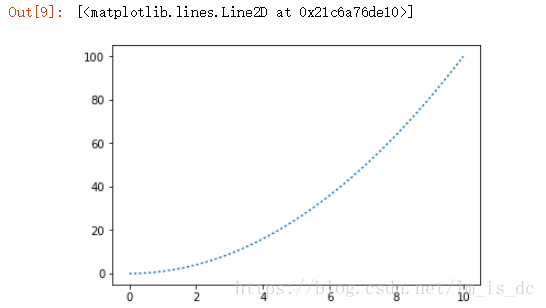
4、线型
参数linestyle或ls
| 线条风格 | 描述 | 线条风格 | 描述 |
|---|
| ‘-’ | 实线 | ‘:’ | 虚线 |
| ‘–’ | 破折线 | ‘steps’ | 阶梯线 |
| ‘-.’ | 点划线 | ‘None’ / ‘,’ | 什么都不画 |
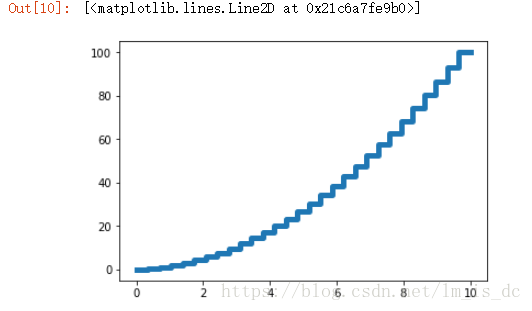
5、线宽
linewidth或lw参数
1
| plt.plot(x,y,ls='steps',lw=5)
|
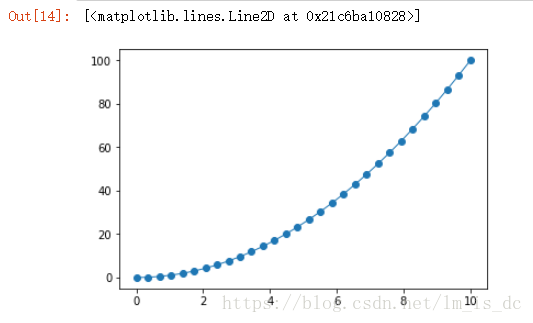
6、点型
- marker 设置点形
- markersize 设置点形大小
| 标记 | 描述 | 标记 | 描述 |
|---|
| ‘s’ | 正方形 | ‘p’ | 五边形 |
| ‘h’ | 六边形1 | ‘H’ | 六边形2 |
| ‘8’ | 八边形 | | |
| 标记 | 描述 | 标记 | 描述 |
|---|
| ‘.’ | 点 | ‘x’ | X |
| ‘*’ | 星号 | ‘+’ | 加号 |
| ‘,’ | 像素 | | |
| 标记 | 描述 | 标记 | 描述 |
|---|
| ‘o’ | 圆圈 | ‘D’ | 菱形 |
| ‘d’ | 小菱形 | ‘’,‘None’,’ ',None | 无 |
| 标记 | 描述 | 标记 | 描述 |
|---|
| ‘1’ | 一角朝下的三脚架 | ‘3’ | 一角朝左的三脚架 |
| ‘2’ | 一角朝上的三脚架 | ‘4’ | 一角朝右的三脚架 |
1
| plt.plot(x,y,marker='o',lw=1)
|
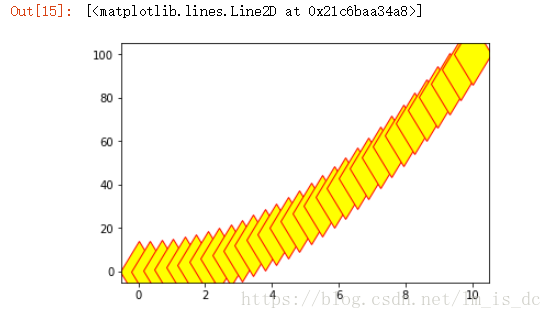
plot参数设置marker前后景色:markerfacecolor=‘white’,markeredgecolor=‘black’ markersize=30设置大小 。
1
| plt.plot(x,y,marker='d',lw=3,markerfacecolor='yellow',markeredgecolor='red',markersize=40)
|
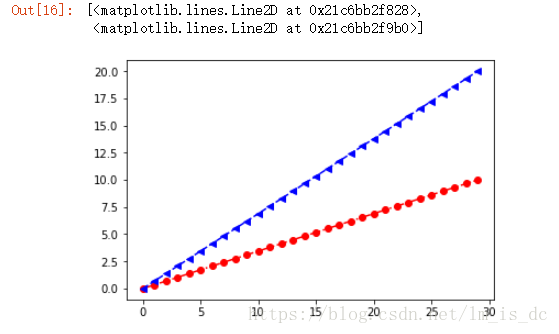
7、多参数连用
注意:只可以设置颜色、点型、线型,可以把几种参数写在一个字符串内进行设置 ‘r-.o’ 。
1
| plt.plot(x,'or-.',x*2,'b--<')
|
更多点和线的设置
| 参数 | 描述 | 参数 | 描述 |
|---|
| color或c | 线的颜色 | linestyle或ls | 线型 |
| linewidth或lw | 线宽 | marker | 点型 |
| markeredgecolor | 点边缘的颜色 | markeredgewidth | 点边缘的宽度 |
| markerfacecolor | 点内部的颜色 | markersize | 点的大小 |
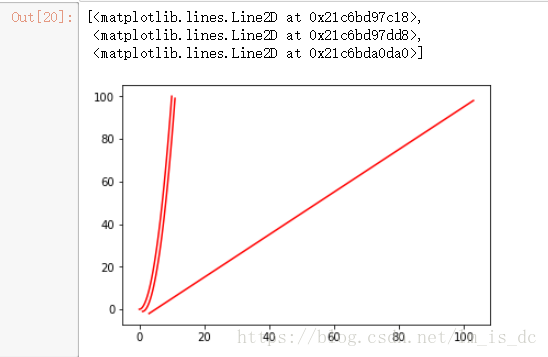
8、在一条语句中为多个曲线进行设置
8.1 多个曲线同一设置
属性名声明
注意:不能多参数连用的形式设置 例如:‘rh–’
plt.plot(x1, y1, x2, y2, fmt, …)
1
| plt.plot(x,y,x+1,y-1,y+3,y-2,c='r')
|
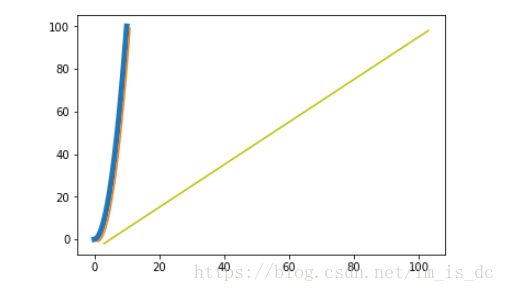
8.2 多个曲线不同设置
多个都进行设置,可以使用多参连用的形式 plt.plot(x1, y1, fmt1, x2, y2, fmt2, …)
1
2
3
| p1,p2,p3=plt.plot(x,y,x+1,y-1,y+3,y-2,)
p1.set_lw(5)
p3.set_color('y')
|
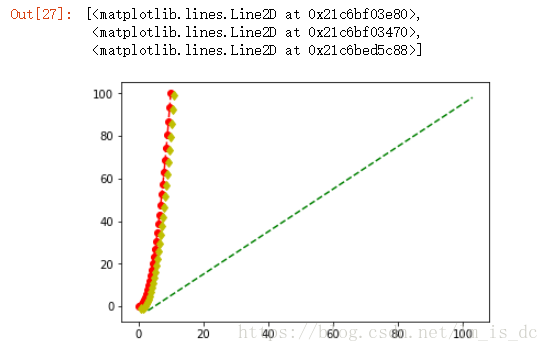
1
| plt.plot(x,y,'or-.',x+1,y-1,'yd',y+3,y-2,'g--')
|
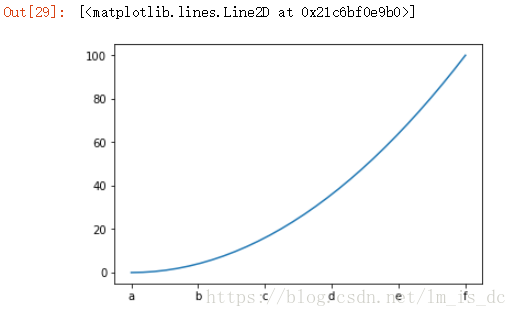
9、X、Y轴坐标刻度
9.1 对x和y轴的刻度做映射
如下方法是对x和y轴的刻度做映射而并非修改
plt.xticks()和plt.yticks()方法
- 需指定刻度值和刻度名称 plt.xticks([刻度列表],[名称列表])
- 支持fontsize、rotation、color等参数设置
1
2
| plt.xticks([0,2,4,6,8,10],['a','b','c','d','e','f'])
plt.plot(x,y)
|
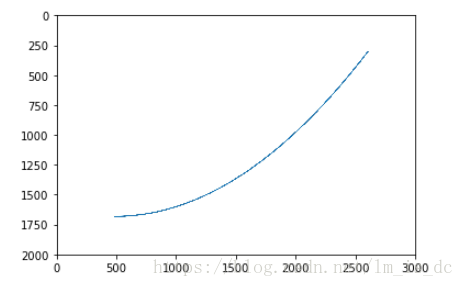
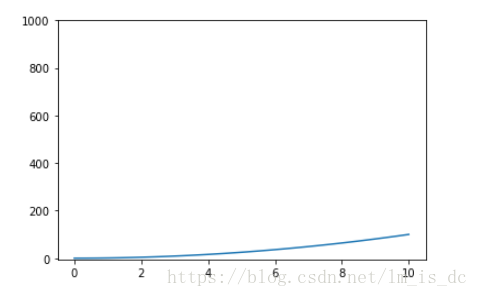
9.2 使用面向对象的方法设置刻度方法
如下方法是用来修改x和y轴的刻度值,而不是映射 使用画板的如下方法设置刻度axes = plt.subplot()
- set_xticks、set_yticks 设置刻度值
- set_xticklabels、set_yticklabels 设置刻度名称
1
2
3
| ax=plt.subplot(111)
ax.plot(x,y)
ax.set_yticks([0,200,400,600,800,1000])
|
三、2D图形
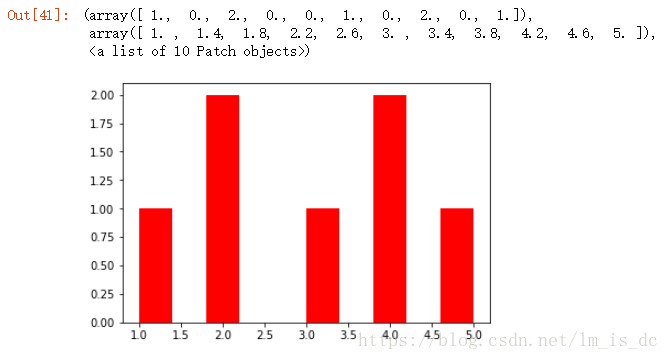
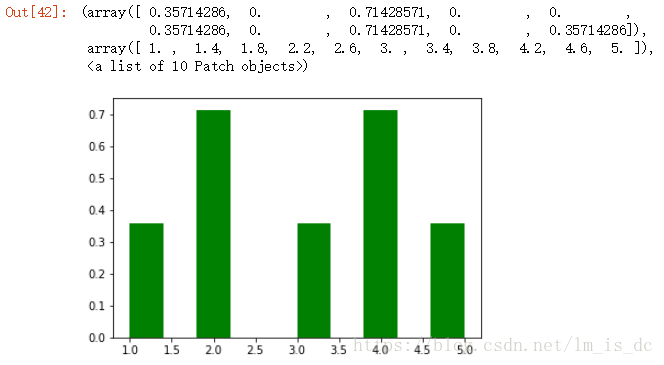
1、直方图
【直方图的参数只有一个x!!!不像条形图需要传入x,y】
plt.hist()的参数:
- bins
可以是一个bin数量的整数值,也可以是表示bin的一个序列。默认值为10 - normed
如果值为True,直方图的值将进行归一化处理,形成概率密度,默认值为False - color
指定直方图的颜色。可以是单一颜色值或颜色的序列。如果指定了多个数据集合,例如DataFrame对象,颜色序列将会设置为相同的顺序。如果未指定,将会使用一个默认的线条颜色 - orientation
通过设置orientation为horizontal创建水平直方图。默认值为vertical
1
2
| x=[1,2,2,3,4,4,5]
plt.hist(x,color='red')
|
1
2
| x=[1,2,2,3,4,4,5]
plt.hist(x,color='g',normed=True)
|
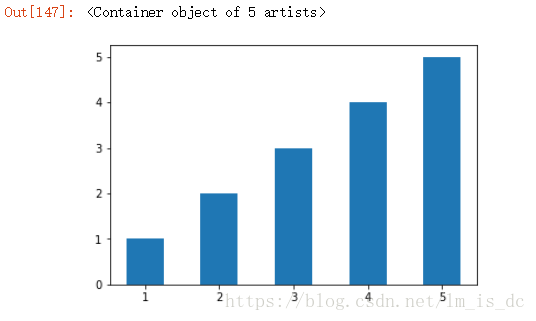
2、条形图:plt.bar()
- 参数:第一个参数是索引。第二个参数是数据值。第三个参数是条形的宽度
-【条形图有两个参数x,y】
- width 纵向设置条形宽度
- height 横向设置条形高度
bar()、barh()
1
2
3
| x=[1,2,3,4,5]
y=[1,2,3,4,5]
plt.bar(x,y,0.5)
|
水平条形图

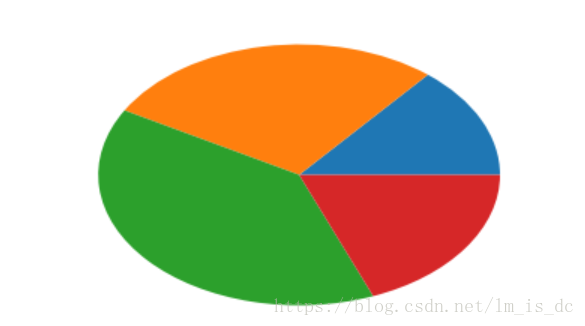
3、饼图
【饼图也只有一个参数x】
pie()
饼图适合展示各部分占总体的比例,条形图适合比较各部分的大小
3.1 普通各部分占满饼图
1
2
| arr=[11,22,31,15]
plt.pie(arr)
|
3.2 普通未占满饼图:小数/比例

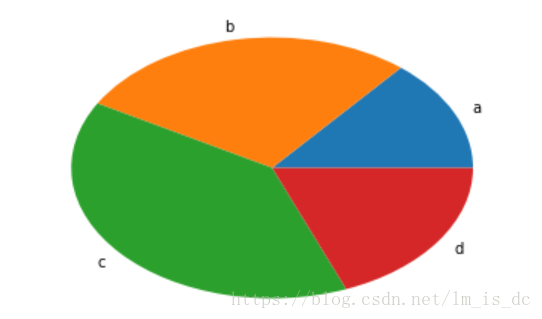
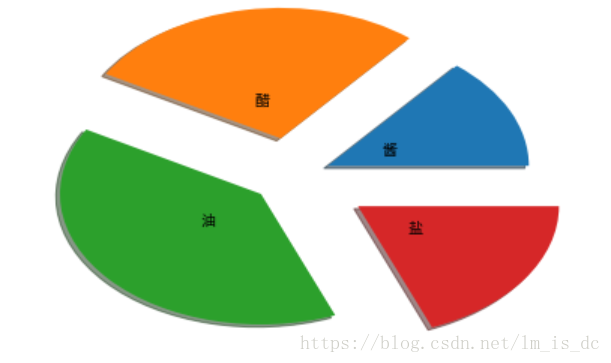
饼图阴影、分裂等属性设置
labels参数设置每一块的标签;
labeldistance参数设置标签距离圆心的距离(比例值)
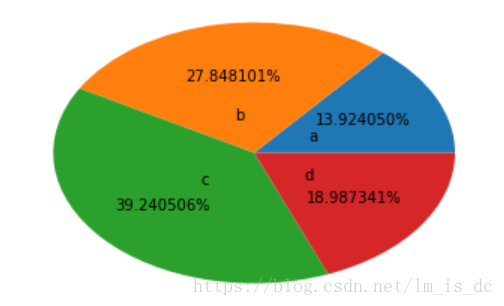
autopct参数设置比例值小数保留位(%.3f%%);
%m.nf m 占位 n 小数点后保留几位 f 是以float格式输出
pctdistance参数设置比例值文字距离圆心的距离
explode参数设置每一块顶点距圆心的长度(比例值,列表);
colors参数设置每一块的颜色(列表);
shadow参数为布尔值,设置是否绘制阴影
startangle参数设置饼图起始角度
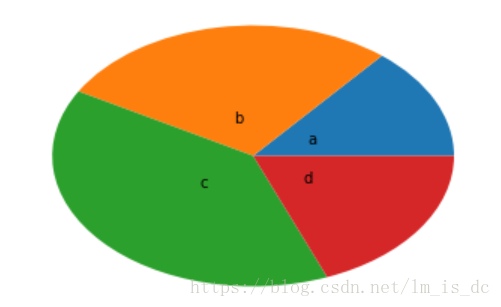
1
2
| arr=[11,22,31,15]
plt.pie(arr,labels=['a','b','c','d'])
|
1
2
| arr=[11,22,31,15]
plt.pie(arr,labels=['a','b','c','d'],labeldistance=0.3)
|
1
2
3
4
5
| arr=[11,22,31,15]
plt.pie(arr,labels=['a','b','c','d'],
labeldistance=0.3,autopct='%.6f%%')
|
1
2
3
4
5
| arr=[11,22,31,15]
plt.pie(arr,labels=['酱','醋','油','盐'],
labeldistance=0.3,
shadow=True,
explode=[0.2,0.3,0.2,0.4])
|
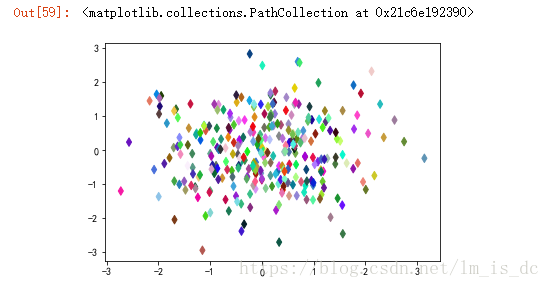
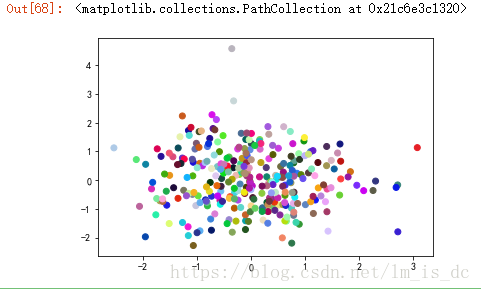
4、散点图:因变量随自变量而变化的大致趋势
【散点图需要两个参数x,y,但此时x不是表示x轴的刻度,而是每个点的横坐标!】
plt.scatter()
1
2
3
| x=np.random.randn(300)
y=np.random.randn(300)
plt.scatter(x,y,marker='d',c=np.random.rand(300,3))
|
1
2
3
4
| x=np.random.randn(300)
y=np.random.randn(300)
plt.scatter(x,y,c=[i for i in random_color(300)])
123
|
四、图形内的文字、注释、箭头
控制文字属性的方法:
| Pyplot函数 | API方法 | 描述 |
|---|
| text() | mpl.axes.Axes.text() | 在Axes对象的任意位置添加文字 |
| xlabel() | mpl.axes.Axes.set_xlabel() | 为X轴添加标签 |
| ylabel() | mpl.axes.Axes.set_ylabel() | 为Y轴添加标签 |
| title() | mpl.axes.Axes.set_title() | 为Axes对象添加标题 |
| legend() | mpl.axes.Axes.legend() | 为Axes对象添加图例 |
| figtext() | mpl.figure.Figure.text() | 在Figure对象的任意位置添加文字 |
| suptitle() | mpl.figure.Figure.suptitle() | 为Figure对象添加中心化的标题 |
| annnotate() | mpl.axes.Axes.annotate() | 为Axes对象添加注释(箭头可选) |
所有的方法会返回一个matplotlib.text.Text对象
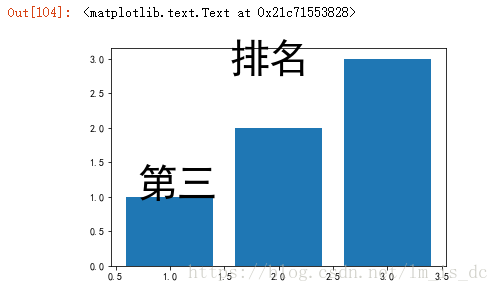
1、图形内的文字
plt.text()
plt.figtext()
1
2
3
4
5
| x=[1,2,3]
y=[1,2,3]
plt.bar(x,y)
plt.text(0.7,1,s='第三',fontsize=40)
plt.figtext(0.4,0.8,s='排名',fontsize=40)
|
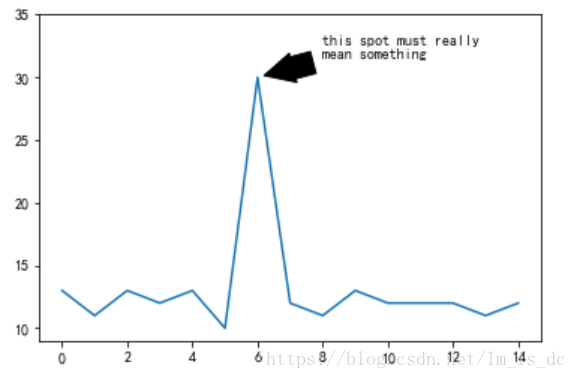
2、注释
annotate() xy参数设置箭头指示的位置,xytext参数设置注释文字的位置 arrowprops参数以字典的形式设置箭头的样式 width参数设置箭头长方形部分的宽度,headlength参数设置箭头尖端的长度, headwidth参数设置箭头尖端底部的宽度,shrink参数设置箭头顶点、尾部与指示点、注释文字的距离(比例值)
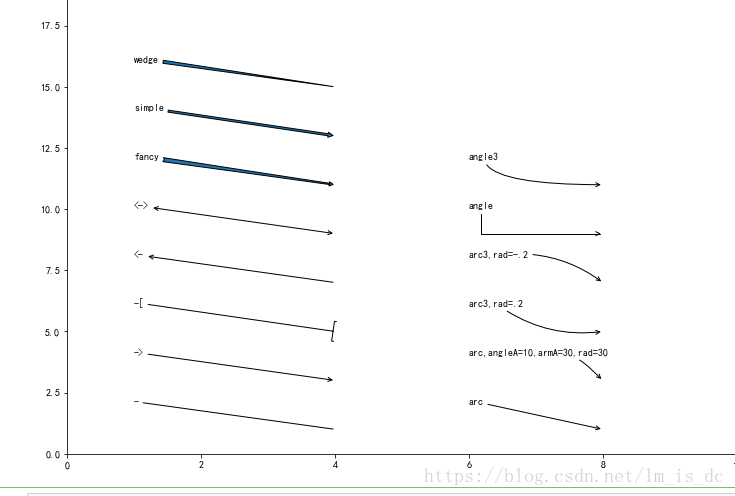
3、箭头
1
2
3
4
5
6
7
8
9
10
11
12
13
14
| plt.figure(figsize=(12,9))
plt.axis([0, 10, 0, 20]);
arrstyles = ['-', '->', '-[', '<-', '<->', 'fancy',
'simple', 'wedge']
for i, style in enumerate(arrstyles):
plt.annotate(style, xytext=(1, 2+2*i), xy=(4, 1+2*i),
arrowprops=dict(arrowstyle=style));
connstyles=["arc", "arc,angleA=10,armA=30,rad=30", "arc3,rad=.2",
"arc3,rad=-.2", "angle", "angle3"]
for i, style in enumerate(connstyles):
plt.annotate(style, xytext=(6, 2+2*i), xy=(8, 1+2*i),
arrowprops=dict(arrowstyle='->', connectionstyle=style));
plt.show()
|
1
2
3
4
5
6
7
8
9
10
11
12
13
14
15
16
17
18
19
20
21
22
23
24
25
26
27
28
29
| ``'-'`` None
``'->'`` head_length=0.4,head_width=0.2
``'-['`` widthB=1.0,lengthB=0.2,angleB=None
``'|-|'`` widthA=1.0,widthB=1.0
``'-|>'`` head_length=0.4,head_width=0.2
``'<-'`` head_length=0.4,head_width=0.2
``'<->'`` head_length=0.4,head_width=0.2
``'<|-'`` head_length=0.4,head_width=0.2
``'<|-|>'`` head_length=0.4,head_width=0.2
``'fancy'`` head_length=0.4,head_width=0.4,tail_width=0.4
``'simple'`` head_length=0.5,head_width=0.5,tail_width=0.2
``'wedge'`` tail_width=0.3,shrink_factor=0.5
y = [13, 11, 13, 12, 13, 10, 30, 12, 11, 13, 12, 12, 12, 11, 12]
plt.plot(y);
plt.ylim(ymax=35);
plt.annotate('this spot must really\nmean something', xy=(6, 30),
xytext=(8, 31.5),
arrowprops=dict(width=15,
headlength=20, headwidth=20,
facecolor='black', shrink=0.1));
plt.show()
|
1
2
3
4
5
6
7
8
9
10
11
12
13
14
15
16
17
18
19
20
21
22
23
24
25
26
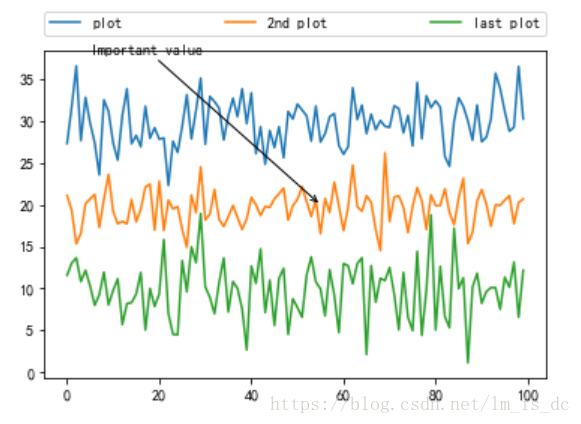
|
x1 = np.random.normal(30, 3, 100)
x2 = np.random.normal(20, 2, 100)
x3 = np.random.normal(10, 3, 100)
plt.plot(x1, label='plot')
plt.plot(x2, label='2nd plot')
plt.plot(x3, label='last plot')
plt.legend(bbox_to_anchor=(0, 1.02, 1, 0.102),
ncol=3,
mode="expand",
borderaxespad=0.)
plt.annotate("Important value",
xy=(55,20),
xytext=(5, 38),
arrowprops=dict(arrowstyle='->'));
|
五、3D图
导包 from mpl_toolkits.mplot3d.axes3d import Axes3D
1
2
3
4
5
| import numpy as np
import matplotlib.pyplot as plt
from mpl_toolkits.mplot3d.axes3d import Axes3D
%matplotlib inline
|
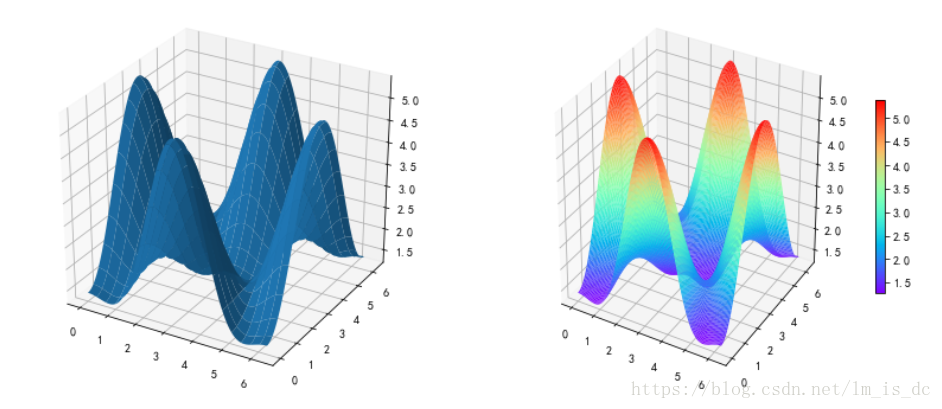
1、曲面图
1
2
3
4
5
6
7
8
9
10
11
12
13
14
15
16
17
18
19
20
21
22
23
24
25
26
27
|
a = 0.7
b = np.pi
def mk_Z(X, Y):
return 2 + a - 2 * np.cos(X) * np.cos(Y) - a * np.cos(b - 2*X)
x = np.linspace(0, 2*np.pi, 100)
y = np.linspace(0, 2*np.pi, 100)
X,Y = np.meshgrid(x, y)
Z = mk_Z(X, Y)
fig = plt.figure(figsize=(14,6))
ax = fig.add_subplot(1, 2, 1, projection='3d')
ax.plot_surface(X,Y,Z,rstride = 5,cstride = 5)
ax = fig.add_subplot(1, 2, 2, projection='3d')
p = ax.plot_surface(X, Y, Z, rstride=1, cstride=1,
cmap='rainbow', antialiased=True)
cb = fig.colorbar(p, shrink=0.5)
|
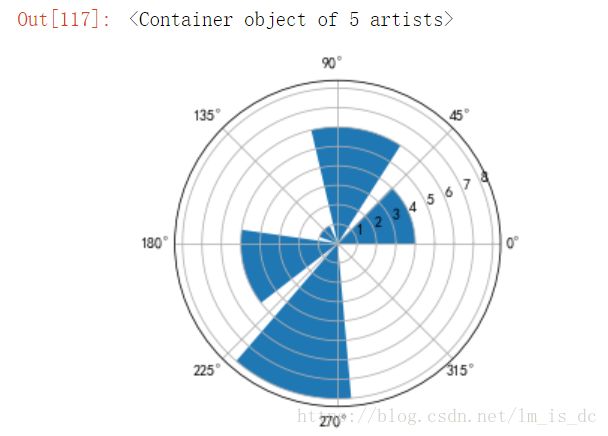
2、玫瑰图/极坐标条形图
1
2
3
4
5
6
7
8
9
10
11
12
13
14
15
16
17
18
19
20
21
22
23
24
25
26
|
def showRose(values,title):
max_value = values.max()
N = 8
angle = np.arange(0.,2 * np.pi, 2 * np.pi / N)
radius = np.array(values)
plt.axes([0, 0, 2, 2], polar=True,facecolor = 'g')
colors = [(1 - x/max_value, 1 - x/max_value, 0.75) for x in radius]
plt.bar(angle, radius, width=(2*np.pi/N), bottom=0.0,
color=colors)
plt.title(title,x=0.2, fontsize=20)
data = np.load('Ravenna_wind.npy')
hist, angle = np.histogram(data,8,[0,360])
showRose(hist,'Ravenna')
|

1
2
3
4
5
|
plt.axes(polar=True)
y = np.array([4,6,1,5,8])
x = np.array([0,1,2,3,4])
plt.bar(x,y,align='edge')
|
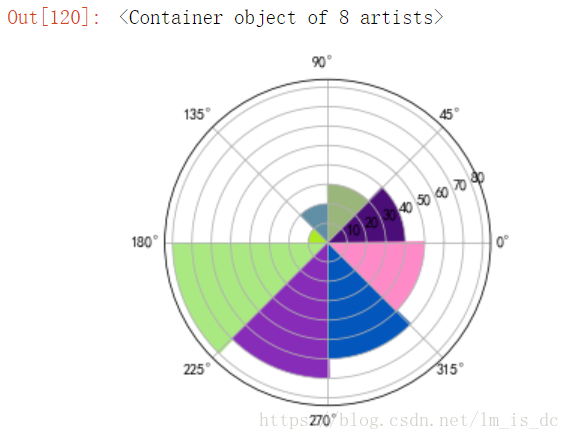
1
2
3
4
5
6
7
8
9
10
11
12
13
14
| values = [40,30,20,10,80,70,60,50]
x = np.linspace(0,2*np.pi,9)[:-1]
c = np.random.random(size=(8,3))
plt.axes(polar=True)
plt.bar(x,values,width=0.8,color=c,align='edge')
|