1
2
3
4
5
6
7
8
9
10
11
12
13
14
15
16
17
18
19
20
21
22
23
24
25
26
27
28
29
30
31
32
33
34
35
36
37
38
39
40
41
42
43
44
45
46
47
48
49
50
51
52
53
54
55
56
57
58
59
60
61
62
63
64
65
66
67
68
69
70
71
72
73
74
75
76
77
78
79
80
81
82
83
84
85
86
87
88
89
90
91
|
from sklearn.linear_model import LogisticRegression
import numpy as np
import matplotlib as mpl
import matplotlib.pyplot as plt
'''
datas
labels
'''
def logistic(datas, labels, titleOfChart, x_label, y_label):
plt.figure()
datas=np.array(datas)
datas=datas.astype(float)
labels=np.array(labels)
clf = LogisticRegression()
for i in range(len(labels)):
if labels[i] == 'Iris-setosa':
labels[i] = 0
elif labels[i] == 'Iris-versicolor':
labels[i] = 1
else:
labels[i] = 2
labels = labels.astype(np.int)
clf.fit(datas, labels)
N, M = 500, 500
x1_min, x2_min = datas.min(axis=0)
x1_max, x2_max = datas.max(axis=0)
t1 = np.linspace(x1_min, x1_max, N)
t2 = np.linspace(x2_min, x2_max, M)
x1, x2 = np.meshgrid(t1, t2)
x_show = np.stack((x1.flat, x2.flat), axis=1)
y_predict = clf.predict(x_show)
cm_light = mpl.colors.ListedColormap(['#A0FFA0', '#FFA0A0', '#A0A0FF'])
cm_dark = mpl.colors.ListedColormap(['g', 'r', 'b'])
plt.pcolormesh(x1, x2, y_predict.reshape(x1.shape), shading='auto', cmap=cm_light)
plt.scatter(datas[:,0], datas[:,1], c=labels.transpose(), cmap=cm_dark, marker='o', edgecolors='k')
plt.xlim(x1_min, x1_max)
plt.ylim(x2_min, x2_max)
plt.title(titleOfChart, fontsize=15)
plt.xlabel(x_label, fontsize=11)
plt.ylabel(y_label, fontsize=11)
plt.show()
mpl.rcParams["font.sans-serif"]=["SimHei"]
mpl.rcParams["axes.unicode_minus"]=False
cm_light = mpl.colors.ListedColormap(['g', 'r', 'b'])
attributes=['SepalLength','SepalWidth','PetalLength','PetalWidth']
datas1=[]
datas2=[]
datas3=[]
datas4=[]
labels1=[]
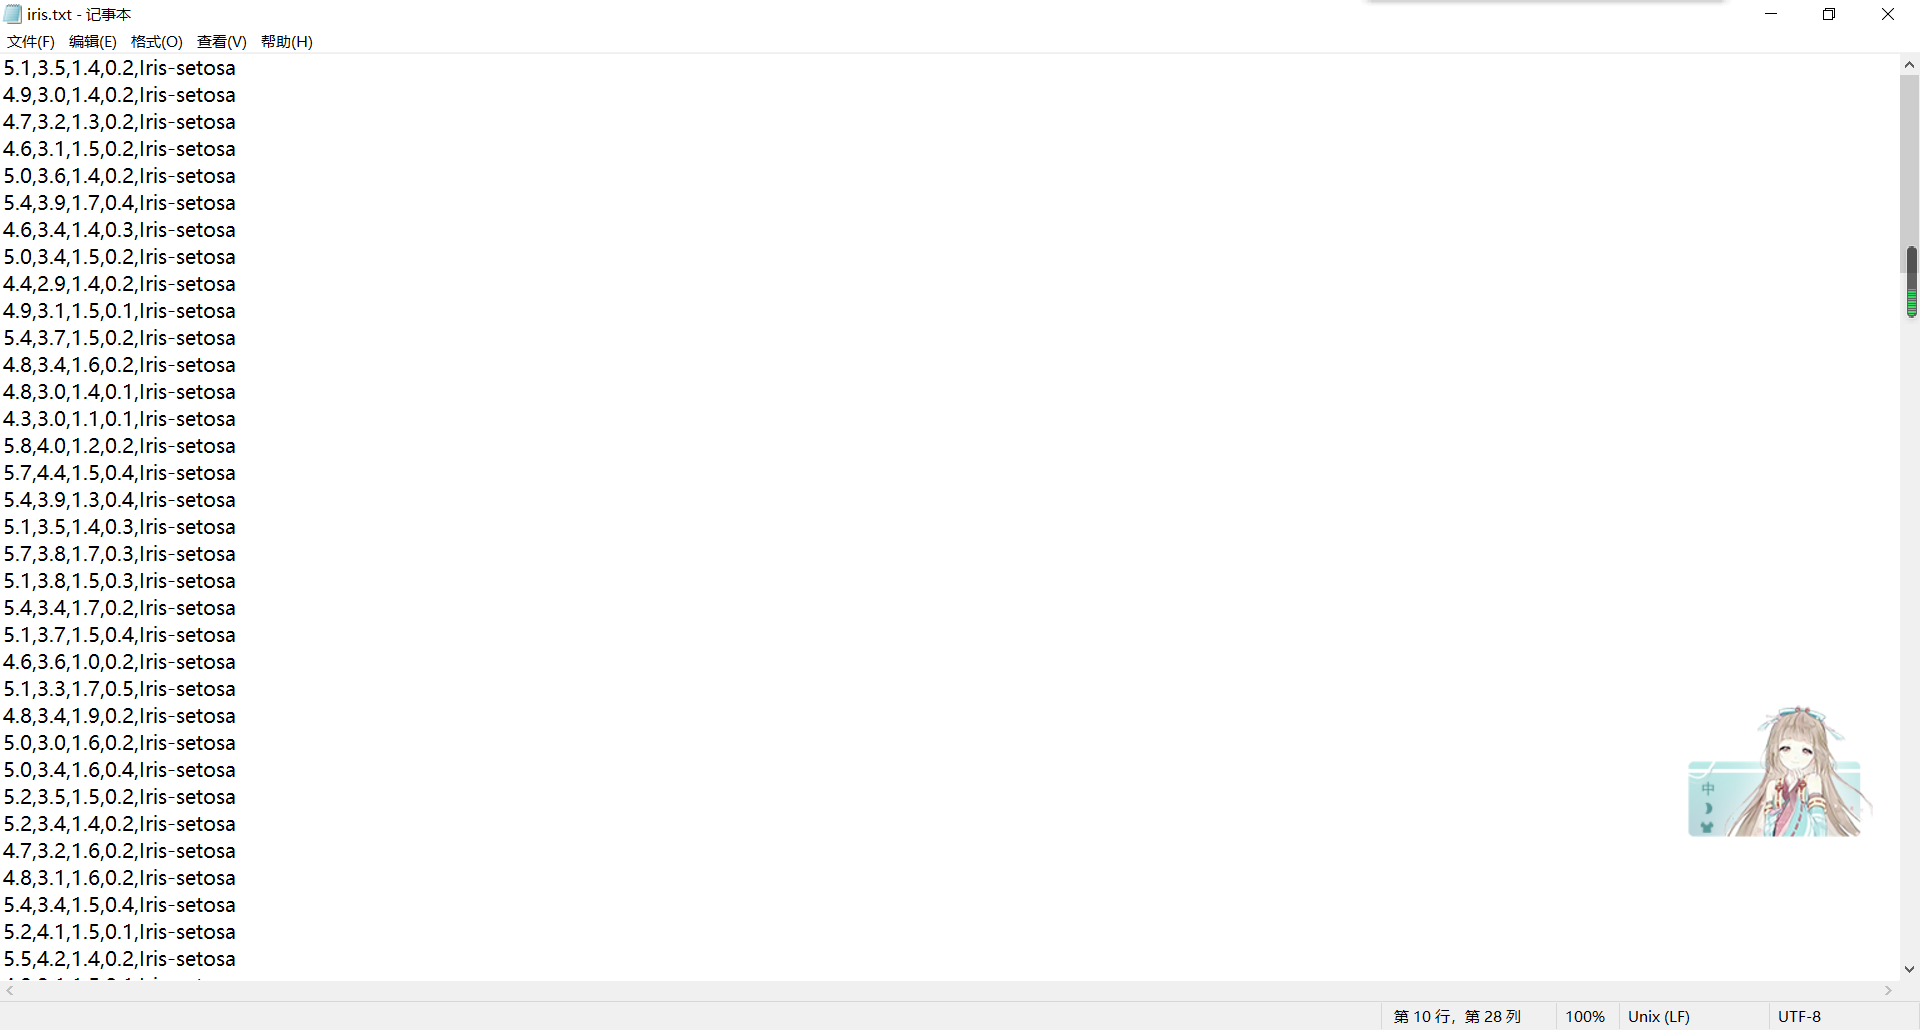
data_file=open('iris.txt','r')
for line in data_file.readlines():
linedata = line.split(',')
if len(linedata) == 5:
linedata = np.array(linedata)
datas1.append(linedata[:2])
labels1.append(linedata[-1].replace('\n', ''))
datas2.append(linedata[2:4])
datas3.append(linedata[:][0:4:3])
datas4.append(linedata[1:3])
data_file.close()
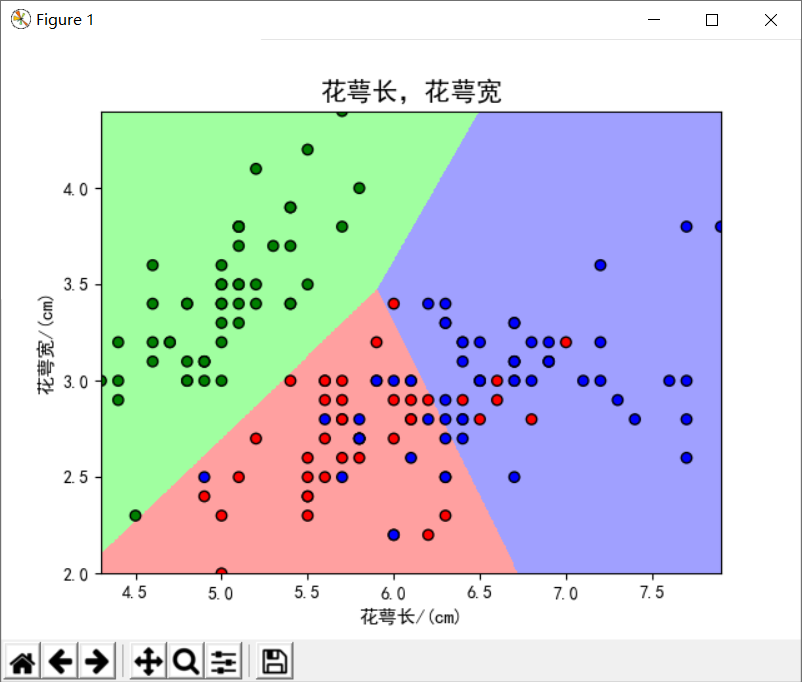
logistic(datas1,labels1, "花萼长,花萼宽", "花萼长/(cm)", "花萼宽/(cm)")
logistic(datas2,labels1, "花瓣长,花瓣宽", "花瓣长/(cm)", "花瓣宽/(cm)")
logistic(datas3,labels1, "花萼长,花瓣宽", "花萼长/(cm)", "花瓣宽/(cm)")
logistic(datas4,labels1, "花萼宽,花瓣长", "花萼宽/(cm)", "花瓣长/(cm)")
|

