1
2
3
4
5
6
7
8
9
10
11
12
13
14
15
16
17
18
19
20
21
22
23
24
25
26
27
28
29
30
31
32
33
34
35
36
37
38
39
40
41
42
43
44
45
46
47
48
49
50
51
52
53
54
55
56
57
58
59
60
61
62
63
64
65
66
67
68
69
70
71
72
73
74
75
76
77
78
79
80
81
82
83
84
85
86
87
88
89
90
91
92
93
94
95
96
97
98
99
100
101
102
103
104
105
106
107
108
109
110
111
112
113
114
115
116
117
118
119
120
121
122
123
124
125
126
127
128
129
130
|
"""
Created on Thu Oct 15 20:05:49 2020
@author: 23820
"""
import numpy as np
import matplotlib.pyplot as plt
from matplotlib.ticker import MultipleLocator, FormatStrFormatter
def minmax_value(list1):
    minvalue=min(list1)
    maxvalue=max(list1)
    return minvalue,maxvalue
plt.figure(figsize=(16,14),dpi=98)
xmajorLocator = MultipleLocator(1)
plt.rcParams['font.sans-serif']=['SimHei']
plt.rcParams['axes.unicode_minus'] = False
p1 = plt.subplot(121)
p2 = plt.subplot(122)
pointcount=5
x=[i for i in range(20)]
print(x)
y1=[i**2 for i in range(20)]
y2=[i*4 for i in range(20)]
y3=[i*3+2 for i in range(20)]
y4=[i*4 for i in range(20)]
for i in range(len(x)-1):
if i<pointcount:
minx,maxx=minmax_value(x[:pointcount])
minx,maxx=minmax_value(x[:pointcount])
minyA,maxyA=minmax_value(y1[:pointcount])
minyB,maxyB=minmax_value(y2[:pointcount])
maxy1=max(maxyA,maxyB)
miny1=min(minyA,minyB)
p1.axis([minx,maxx,miny1,maxy1])
p1.grid(True)
A,=p1.plot(x[:pointcount],y1[:pointcount],"g-")
B,=p1.plot(x[:pointcount],y2[:pointcount],"b-")
p1.xaxis.set_major_locator(xmajorLocator)
legend=p1.legend(handles=[A,B],labels=["图1","图2"])
minx,maxx=minmax_value(x[:pointcount])
minx,maxx=minmax_value(x[:pointcount])
minyA,maxyA=minmax_value(y3[:pointcount])
minyB,maxyB=minmax_value(y4[:pointcount])
maxy1=max(maxyA,maxyB)
miny1=min(minyA,minyB)
p2.axis([minx,maxx,miny1,maxy1])
p2.grid(True)
A,=p2.plot(x[:pointcount],y3[:pointcount],"r-")
B,=p2.plot(x[:pointcount],y4[:pointcount],"y-")
p2.xaxis.set_major_locator(xmajorLocator)
legend=p2.legend(handles=[A,B],labels=["图3","图4"])
elif i>=pointcount:
minx,maxx=minmax_value(x[i-pointcount:i])
minx,maxx=minmax_value(x[i-pointcount:i])
minyA,maxyA=minmax_value(y1[i-pointcount:i])
minyB,maxyB=minmax_value(y2[i-pointcount:i])
maxy1=max(maxyA,maxyB)
miny1=min(minyA,minyB)
p1.axis([minx,maxx,miny1,maxy1])
p1.grid(True)
A,=p1.plot(x[i-pointcount:i],y1[i-pointcount:i],"g-")
B,=p1.plot(x[i-pointcount:i],y2[i-pointcount:i],"b-")
p1.xaxis.set_major_locator(xmajorLocator)
legend=p1.legend(handles=[A,B],labels=["图1","图2"])
minx,maxx=minmax_value(x[i-pointcount:i])
minx,maxx=minmax_value(x[i-pointcount:i])
minyA,maxyA=minmax_value(y3[i-pointcount:i])
minyB,maxyB=minmax_value(y4[i-pointcount:i])
maxy1=max(maxyA,maxyB)
miny1=min(minyA,minyB)
p2.axis([minx,maxx,miny1,maxy1])
p2.grid(True)
A,=p2.plot(x[i-pointcount:i],y3[i-pointcount:i],"r-")
B,=p2.plot(x[i-pointcount:i],y4[i-pointcount:i],"y-")
p2.xaxis.set_major_locator(xmajorLocator)
legend=p2.legend(handles=[A,B],labels=["图3","图4"])
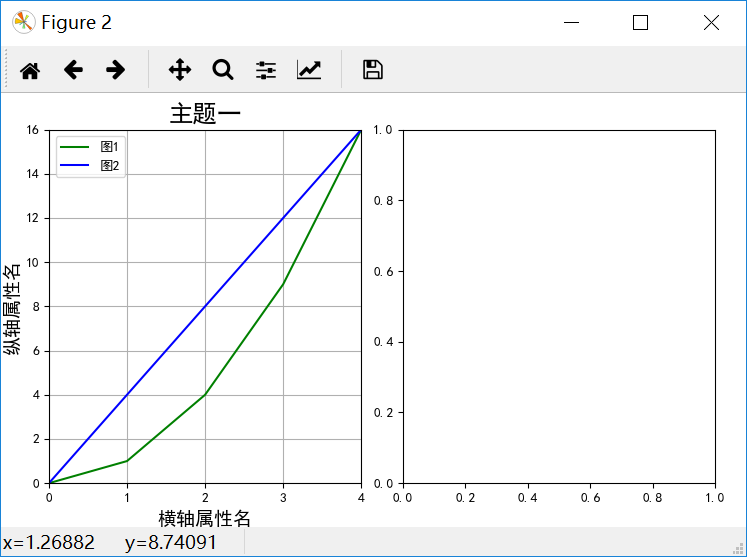
p1.set_xlabel("横轴属性名一",fontsize=14)
p1.set_ylabel("纵轴属性名一",fontsize=14)
p1.set_title("主题一",fontsize=18)
p2.set_xlabel("横轴属性名二",fontsize=14)
p2.set_ylabel("纵轴属性名二",fontsize=14)
p2.set_title("主题二",fontsize=18)
plt.pause(0.3)
plt.tight_layout(pad=4, w_pad=4.0, h_pad=3.0)
|


