Matplotlib中xlim,ylim,axis结构与用法
参考链接:https://blog.csdn.net/The_Time_Runner/article/details/89928057
matplotlib.pyplot.xlim() 官方文档
1 | |
获取或者是设定x座标轴的范围,当前axes上的座标轴。
有两种参数输入方式
plt.xlim(num1, num2)
<!--code1-->

matplotlib.pyplot.ylim 官方文档
内容与x一样
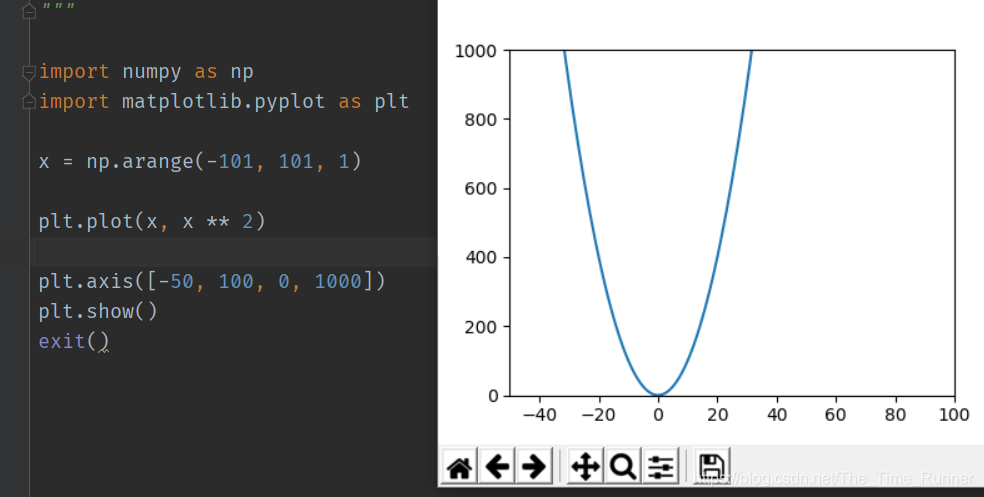
matplotlib.pyplot.axis 官方文档
1 | |
参数详解:
xmin, xmax, ymin, ymax : float, optional(浮点数,可选)
option : str
Value Description ‘on’ Turn on axis lines and labels.(启用轴线和标签。) ‘off’ Turn off axis lines and labels. ‘equal’ Set equal scaling (i.e., make circles circular) by changing axis limits.(通过更改轴限制来设置等比例缩放(即使圆成为圆形)。) ‘scaled’ Set equal scaling (i.e., make circles circular) by changing dimensions of the plot box.(通过更改绘图框的尺寸设置等比例缩放(即使圆成为圆形)。) ‘tight’ Set limits just large enough to show all data.(设置足够大的限制以显示所有数据。) ‘auto’ Automatic scaling (fill plot box with data).(自动缩放(用数据填充绘图框)。) ‘normal’ Same as ‘auto’; deprecated.(废弃) ‘image’ ‘scaled’ with axis limits equal to data limits.(轴限制等于数据限制的“缩放”。) ‘square’ Square plot; similar to ‘scaled’, but initially forcing xmax-xmin = ymax-ymin.(正方形图;类似于“scaled”,但最初强制使用“xmax xmin=ymax ymin”。)emit : bool, optional, default True
Matplotlib中xlim,ylim,axis结构与用法
https://fulequn.github.io/2020/09/Article202009267/